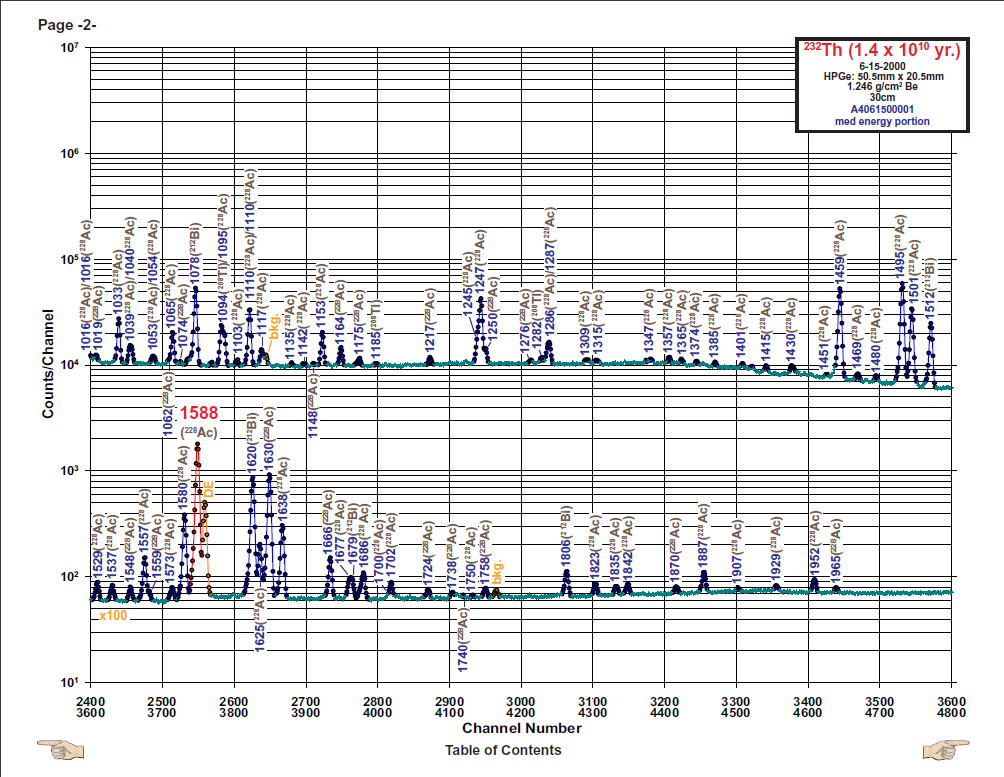
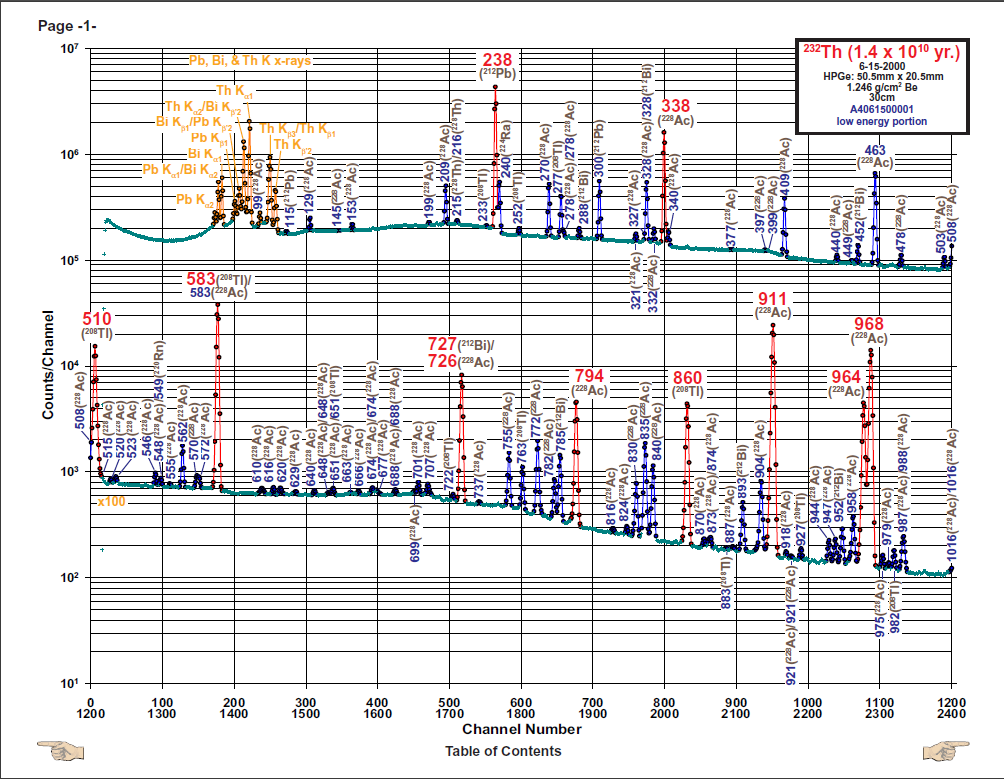
Siamo tornati nuovamente a Bicocca (8 settembre 2022): verranno acquisiti spettri col germanio raffreddato e pozzetto di
import struct
import os
import sys
import numpy as np
from matplotlib import pyplot as plt
from scipy.optimize import curve_fit
myEvent = np.dtype([
('timestamp', np.dtype('u8')),
('qshort', np.dtype('u2')),
('qlong', np.dtype('u2')),
('baseline', np.dtype('u2')),
('channel', np.dtype('u1')),
('PUR', np.dtype('u1')),
])
with open("./datiGermanio2Volta/Germanio_241Am_137Cs_60Co_events.ade", "rb") as f:
myData = np.fromfile(f, dtype = myEvent)
# Sensato da vedere
%matplotlib inline
#%matplotlib qt
h, bins = np.histogram(myData["qlong"], bins = 1000)
binc = bins[:-1] + (bins[1] - bins[0])/2
fig, ax = plt.subplots()
fig.set_size_inches(12,5)
ax.plot(binc, h, ds = "steps-mid", c = "darkgreen", lw = 1, label = "Spettro")
ax.fill_between(binc, h, step = "mid", color = "lime", alpha = 1)
ax.grid()
ax.set_xlabel("Energia [ADC]", fontsize = 14)
ax.set_ylabel("Entries", fontsize = 14)
ax.set_title("Sorgente calibrazione", fontsize = 16)
ax.legend()
ax.set_yscale("log")
fig.savefig("pdfPerave/sorgCal.pdf", format = "pdf")
plt.show()
# Massima definizione
%matplotlib inline
myBin = np.arange(-.5, 60000.5, 1)
h, bins = np.histogram(myData["qlong"], bins = myBin)
binc = bins[:-1] + (bins[1] - bins[0])/2
fig, ax = plt.subplots()
fig.set_size_inches(12,5)
ax.plot(binc, h, ds = "steps-mid", c = "darkgreen", lw = 1, label = "Spettro")
ax.fill_between(binc, h, step = "mid", color = "lime", alpha = 1)
ax.grid()
ax.set_xlabel("Energia [ADC]", fontsize = 14)
ax.set_ylabel("Entries", fontsize = 14)
ax.set_title("Sorgente calibrazione", fontsize = 16)
ax.legend()
ax.set_yscale("log")
plt.show()
%matplotlib inline
def myGauss(x, a, mu, sigma, m, q):
return a * np.exp ( -(x-mu)**2 / (2*sigma**2) ) + m*x + q
lstRange = [(1219, 1600), (15381, 15605), (27398, 27579), (31130, 31316), ]
lstPicchi = []
lstErrPicchi = []
energieVere = np.array([60, 661, 1173, 1332])
fig, ax = plt.subplots(4,1)
fig.set_size_inches(12, 20)
#fig.subplots_adjust(hspace = .4)
for i in range(len(lstRange)):
cond = (binc > lstRange[i][0]) & (binc < lstRange[i][1]) & (h>0)
xData = binc[cond]
yData = h[cond]
ax[i].plot(xData, yData, ds = "steps-mid", c = "darkgreen", lw = 1, label = "Spettro")
ax[i].fill_between(xData, yData, step = "mid", color = "lime", alpha = 1)
popt, pcov = curve_fit(myGauss, xData, yData, sigma = np.sqrt(yData),
absolute_sigma = True, maxfev = 1000000,
p0 = [np.max(yData), xData[np.argmax(yData)], 100, -1, 10])
ax[i].plot(xData, myGauss(xData, *popt), ":k")
lstPicchi.append(popt[1])
lstErrPicchi.append(np.sqrt(pcov[1,1]))
for a in ax:
a.grid()
a.set_xlabel("Energia [ADC]", fontsize = 14)
a.set_ylabel("Entries", fontsize = 14)
plt.show()
lstPicchi = np.array(lstPicchi)
lstErrPicchi = np.array(lstErrPicchi)
# Retta di calibrazione
def myLine(x,m,q):
return m*x+q
popt, pcov = curve_fit(myLine, energieVere, lstPicchi, p0 = (35, 31))
fig, ax = plt.subplots()
ax.plot(energieVere, lstPicchi, "*g", label = "Dati")
ax.plot(energieVere, myLine(energieVere, *popt), ":k", label = "Retta fittata")
ax.set_title("Retta di calibrazione", fontsize = 16)
ax.set_xlabel("Energia vera [keV]", fontsize = 14)
ax.set_ylabel("Energia [ADC]", fontsize = 14)
plt.legend(fontsize = 14)
plt.grid()
plt.show()
m = 1/popt[0]
q = -popt[1]/popt[0]
residui = (myLine(lstPicchi, m, q) - energieVere) / energieVere
fig, ax = plt.subplots()
ax.plot(energieVere, 100*residui, "*g")
ax.set_title("Residui percentuali", fontsize = 16)
ax.set_xlabel("Energia vera [keV]", fontsize = 14)
ax.set_ylabel("Residui [%]", fontsize = 14)
ax.grid()
plt.show()
# Massima definizione
%matplotlib inline
myBin = np.arange(-.5, 60000.5, 1)
h, bins = np.histogram(myData["qlong"], bins = myBin)
binc = bins[:-1] + (bins[1] - bins[0])/2
binckev = myLine(binc, m, q)
fig, ax = plt.subplots()
fig.set_size_inches(12,5)
ax.plot(binckev, h, ds = "steps-mid", c = "darkgreen", lw = 1, label = "Spettro")
ax.fill_between(binckev, h, step = "mid", color = "lime", alpha = 1)
ax.grid()
ax.set_xlabel("Energia [keV]", fontsize = 14)
ax.set_ylabel("Entries", fontsize = 14)
ax.set_title("Sorgente calibrazione", fontsize = 16)
ax.legend()
ax.set_yscale("log")
plt.show()
%matplotlib inline
def myGauss(x, a, mu, sigma, m, q):
return a * np.exp ( -(x-mu)**2 / (2*sigma**2) ) + m*x + q
lstRange = [(55, 63), (657, 664), (1168, 1174), (1325, 1334), ]
# lstPicchi = []
# lstErrPicchi = []
fig, ax = plt.subplots(4,1)
fig.set_size_inches(12, 20)
#fig.subplots_adjust(hspace = .4)
for i in range(len(lstRange)):
cond = (binckev > lstRange[i][0]) & (binckev < lstRange[i][1]) & (h>0)
xData = binckev[cond]
yData = h[cond]
ax[i].plot(xData, yData, ds = "steps-mid", c = "darkgreen", lw = 1, label = "Spettro")
ax[i].fill_between(xData, yData, step = "mid", color = "lime", alpha = 1)
popt, pcov = curve_fit(myGauss, xData, yData, sigma = np.sqrt(yData),
absolute_sigma = True, maxfev = 1000000,
p0 = [np.max(yData), xData[np.argmax(yData)], 3, -1, 10])
ax[i].plot(xData, myGauss(xData, *popt), ":k")
# lstPicchi.append(popt[1])
# lstErrPicchi.append(np.sqrt(pcov[1,1]))
print(f"La risoluzione energetica per il picco a {energieVere[i]} keV vale {235*np.abs(popt[2])/popt[1]:.2f} %")
for a in ax:
a.grid()
a.set_xlabel("Energia [keV]", fontsize = 14)
a.set_ylabel("Entries", fontsize = 14)
plt.show()
lstPicchi = np.array(lstPicchi)
lstErrPicchi = np.array(lstErrPicchi)
La risoluzione energetica per il picco a 60 keV vale 6.29 % La risoluzione energetica per il picco a 661 keV vale 0.61 % La risoluzione energetica per il picco a 1173 keV vale 0.39 % La risoluzione energetica per il picco a 1332 keV vale 0.34 %
with open("./datiGermanio2Volta/Germanio_232Th_Elettrodi_events.ade", "rb") as f:
myData = np.fromfile(f, dtype = myEvent)
# Massima definizione
%matplotlib inline
myBin = np.arange(-.5, 60000.5, 1)
h, bins = np.histogram(myData["qlong"], bins = myBin)
binc = bins[:-1] + (bins[1] - bins[0])/2
binckev = myLine(binc, m, q)
fig, ax = plt.subplots()
fig.set_size_inches(12,5)
ax.plot(binckev, h, ds = "steps-mid", c = "darkgreen", lw = 1, label = "Spettro")
ax.fill_between(binckev, h, step = "mid", color = "lime", alpha = 1)
ax.grid()
ax.set_xlabel("Energia [keV]", fontsize = 14)
ax.set_ylabel("Entries", fontsize = 14)
ax.set_title("$^{232}Th$ - Elettrodi", fontsize = 16)
ax.legend()
ax.set_yscale("log")
plt.show()
# Sensato da vedere
%matplotlib inline
#%matplotlib qt
h, bins = np.histogram(myData["qlong"], bins = 1000)
binc = bins[:-1] + (bins[1] - bins[0])/2
binckev = myLine(binc, m, q)
fig, ax = plt.subplots()
fig.set_size_inches(12,5)
ax.plot(binckev, h, ds = "steps-mid", c = "darkgreen", lw = 1, label = "Spettro")
ax.fill_between(binckev, h, step = "mid", color = "lime", alpha = 1)
ax.grid()
ax.set_xlabel("Energia [keV]", fontsize = 14)
ax.set_ylabel("Entries", fontsize = 14)
ax.set_title("$^{232}Th$ - Elettrodi", fontsize = 16)
ax.legend()
ax.set_yscale("log")
fig.savefig("pdfPerave/232Th.pdf", format = "pdf")
plt.show()
with open("./datiGermanio2Volta/Germanio_Fertilizzante_events.ade", "rb") as f:
myData = np.fromfile(f, dtype = myEvent)
# Massima definizione
%matplotlib inline
myBin = np.arange(-.5, 60000.5, 1)
h, bins = np.histogram(myData["qlong"], bins = myBin)
binc = bins[:-1] + (bins[1] - bins[0])/2
binckev = myLine(binc, m, q)
fig, ax = plt.subplots()
fig.set_size_inches(12,5)
ax.plot(binckev, h, ds = "steps-mid", c = "darkgreen", lw = 1, label = "Spettro")
ax.fill_between(binckev, h, step = "mid", color = "lime", alpha = 1)
ax.grid()
ax.set_xlabel("Energia [keV]", fontsize = 14)
ax.set_ylabel("Entries", fontsize = 14)
ax.set_title("Fertilizzante", fontsize = 16)
ax.legend()
ax.set_yscale("log")
plt.show()
# Sensato da vedere
%matplotlib inline
#%matplotlib qt
h, bins = np.histogram(myData["qlong"], bins = 1000)
binc = bins[:-1] + (bins[1] - bins[0])/2
binckev = myLine(binc, m, q)
fig, ax = plt.subplots()
fig.set_size_inches(12,5)
ax.plot(binckev, h, ds = "steps-mid", c = "darkgreen", lw = 1, label = "Spettro")
ax.fill_between(binckev, h, step = "mid", color = "lime", alpha = 1)
ax.grid()
ax.set_xlabel("Energia [keV]", fontsize = 14)
ax.set_ylabel("Entries", fontsize = 14)
ax.set_title("Fertilizzante", fontsize = 16)
ax.legend()
ax.set_yscale("log")
fig.savefig("pdfPerave/fertilizzante.pdf", format = "pdf")
plt.show()
with open("./datiGermanio2Volta/Germanio_Fosforite_events.ade", "rb") as f:
myData = np.fromfile(f, dtype = myEvent)
# Massima definizione
%matplotlib inline
myBin = np.arange(-.5, 60000.5, 1)
h, bins = np.histogram(myData["qlong"], bins = myBin)
binc = bins[:-1] + (bins[1] - bins[0])/2
binckev = myLine(binc, m, q)
fig, ax = plt.subplots()
fig.set_size_inches(12,5)
ax.plot(binckev, h, ds = "steps-mid", c = "darkgreen", lw = 1, label = "Spettro")
ax.fill_between(binckev, h, step = "mid", color = "lime", alpha = 1)
ax.grid()
ax.set_xlabel("Energia [keV]", fontsize = 14)
ax.set_ylabel("Entries", fontsize = 14)
ax.set_title("Fosforite", fontsize = 16)
ax.legend()
ax.set_yscale("log")
plt.show()
# Sensato da vedere
%matplotlib inline
#%matplotlib qt
h, bins = np.histogram(myData["qlong"], bins = 1000)
binc = bins[:-1] + (bins[1] - bins[0])/2
binckev = myLine(binc, m, q)
fig, ax = plt.subplots()
fig.set_size_inches(12,5)
ax.plot(binckev, h, ds = "steps-mid", c = "darkgreen", lw = 1, label = "Spettro")
ax.fill_between(binckev, h, step = "mid", color = "lime", alpha = 1)
ax.grid()
ax.set_xlabel("Energia [keV]", fontsize = 14)
ax.set_ylabel("Entries", fontsize = 14)
ax.set_title("Fosforite", fontsize = 16)
ax.legend()
ax.set_yscale("log")
fig.savefig("pdfPerave/fosforite.pdf", format = "pdf")
plt.show()
with open("./datiGermanio2Volta/Germanio_241Am_137Cs_60Co_events.ade", "rb") as f:
myData = np.fromfile(f, dtype = myEvent)
# Massima definizione
%matplotlib inline
myBin = np.arange(-.5, 60000.5, 1)
h, bins = np.histogram(myData["qlong"], bins = myBin)
binc = bins[:-1] + (bins[1] - bins[0])/2
binckev = myLine(binc, m, q)
fig, ax = plt.subplots()
fig.set_size_inches(12,5)
ax.plot(binckev, h, ds = "steps-mid", c = "darkgreen", lw = 1, label = "Spettro")
ax.fill_between(binckev, h, step = "mid", color = "lime", alpha = 1)
ax.grid()
ax.set_xlabel("Energia [keV]", fontsize = 14)
ax.set_ylabel("Entries", fontsize = 14)
ax.set_title("Fosforite", fontsize = 16)
ax.legend()
ax.set_yscale("log")
plt.show()
# Sensato da vedere
%matplotlib inline
#%matplotlib qt
h, bins = np.histogram(myData["qlong"], bins = 1000)
binc = bins[:-1] + (bins[1] - bins[0])/2
binckev = myLine(binc, m, q)
fig, ax = plt.subplots()
fig.set_size_inches(12,5)
ax.plot(binckev, h, ds = "steps-mid", c = "darkgreen", lw = 1, label = "Spettro")
ax.fill_between(binckev, h, step = "mid", color = "lime", alpha = 1)
ax.grid()
ax.set_xlabel("Energia [keV]", fontsize = 14)
ax.set_ylabel("Entries", fontsize = 14)
ax.set_title("Fosforite", fontsize = 16)
ax.legend()
ax.set_yscale("log")
fig.savefig("pdfPerave/fosforite.pdf", format = "pdf")
plt.show()
# Massima definizione
%matplotlib inline
myBin = np.arange(-.5, 60000.5, 1)
h, bins = np.histogram(myData["qlong"], bins = myBin)
binc = bins[:-1] + (bins[1] - bins[0])/2
binckev = myLine(binc, m, q)
fig, ax = plt.subplots()
fig.set_size_inches(12,5)
ax.plot(binckev, h, ds = "steps-mid", c = "darkgreen", lw = 1, label = "Spettro")
ax.fill_between(binckev, h, step = "mid", color = "lime", alpha = 1)
### Fit
xMin = 1325
xMax = 1335
cond = (binckev > xMin) & (binckev < xMax) & (h > 0)
xData = binckev[cond]
yData = h[cond]
p0 = [np.max(yData), xData[np.argmax(yData)], 5, 0, 0]
popt, pcov = curve_fit(myGauss, xData, yData, sigma = np.sqrt(yData), absolute_sigma = True,
p0 = p0, maxfev = 10000000)
ax.plot(xData, myGauss(xData, *popt), ":k", label = "Curva fittata")
ax.grid()
ax.set_xlabel("Energia [keV]", fontsize = 14)
ax.set_ylabel("Entries", fontsize = 14)
ax.set_title("Fosforite", fontsize = 16)
ax.legend()
ax.set_yscale("log")
ax.set_xlim(xMin, xMax)
plt.show()
print(f"La risoluzione energetica al picco 1332keV del 60Co vale {235*popt[2]/popt[1]:.2f} %, mentre col sistema tradizionale vale 0.14 %")
La risoluzione energetica al picco 1332keV del 60Co vale 0.30 %, mentre col sistema tradizionale vale 0.14 %