Magnetic field for an MBPL Magnet with a 110mm aperture
- Max current is 830 A
- Polarity is S, which means
- Positive current deflects positron toward Salève
- Negative current deflects positron toward Jura
In [1]:
import numpy as np
from matplotlib import pyplot as plt
In [2]:
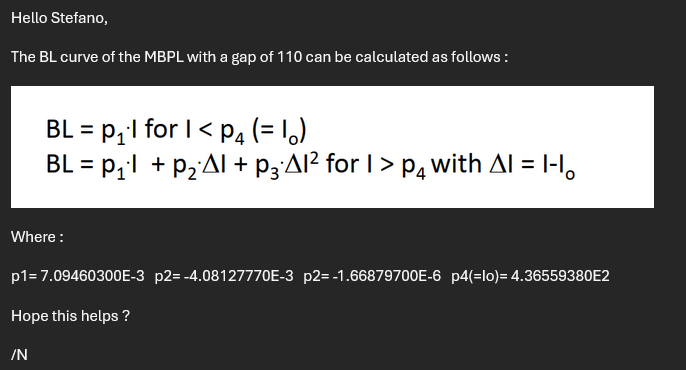
p1 = 7.09460300E-3
p2 = -4.08127770E-3
p3 = -1.66879700E-6
p4 = 4.36559380E2

I0 = p4

Imax = 830
In [3]:
I = np.linspace(0, Imax, 1000)
deltaI = I - I0

BL = np.zeros_like(I)

myLogic = I <= I0
BL[myLogic] = p1 * I[myLogic]

myLogic = I > I0
BL[myLogic] = p1 * I[myLogic] + p2 * deltaI[myLogic] + p3 * deltaI[myLogic]**2
Magnetic field as a function of the deflection angle
In [4]:
fig, ax = plt.subplots()
fig.set_size_inches(12, 5)

ax.plot(I, BL, c = "darkgreen", label = "MBPL 03", lw = 3)

ax.grid()
ax.set_xlabel("Current (A)", fontsize = 14)
ax.set_ylabel("Magnetic field BL (T*m)", fontsize = 14)
ax.legend(fontsize = 14)

plt.show()

Deflection as a function of the magnetic field for different beam momenta
The formula for calculating the deflection is \begin{equation} \theta(\text{mrad}) = \frac{299.79 * B\cdot L (\text{T}\cdot \text{m})}{p(\text{GeV/c})} \end{equation}
In [5]:
# Returns the deflection in mrad as a function of the magnetic field and the particle momentum
def deflection(BL, p):
    return 299.79 * BL / p

defl_20 = deflection(BL, 20)
defl_120 = deflection(BL, 120)
defl_35 = deflection(BL, 35)
In [6]:
defl_800A_120GeV = defl_120[I>=800][0]
print(f"A 800 A, il fascio da 120 GeV/c deflette di {defl_800A_120GeV:.2f} mrad")

print(f"Per avere la stessa deflessione a 35 GeV/c, serve una corrente di {I[defl_35>=defl_800A_120GeV][0]:.2f} A")
A 800 A, il fascio da 120 GeV/c deflette di 9.92 mrad
Per avere la stessa deflessione a 35 GeV/c, serve una corrente di 163.67 A
In [7]:
fig, ax = plt.subplots()
fig.set_size_inches(12, 5)

ax.plot(I, defl_20, c = "darkgreen", label = "20 GeV/c", lw = 3)
ax.plot(I, defl_120, c = "darkorchid", label = "120 GeV/c", lw = 3)
ax.plot(I, defl_35, c = "orange", label = "35 GeV/c", lw = 3)

ax.grid()
ax.set_xlabel("Current (A)", fontsize = 14)
ax.set_ylabel("Deflection (mrad)", fontsize = 14)
ax.legend(fontsize = 14)

plt.show()
